By David B. Pankratz, Research & Policy Director, Greater Pittsburgh Arts Council (GPAC)
 Yes, Culture Counts in Greater Pittsburgh. The arts & culture sector annually supports 29,347 full-time equivalent jobs, $567,655,591 in household income, and $108,657,526 in state and local taxes.
The Greater Pittsburgh Arts Council (GPAC) wanted to know more about the health of our arts & culture sector. How does 2015 compare to 2010? How does Pittsburgh stack up against other metro areas nationwide? How do arts & culture compare with other business sectors?
Our 2016 Greater Pittsburgh Culture Counts report—prepared with help from DataArts and the Greater Philadelphia Cultural Alliance’s Culture Across Communities: An 11-City Snapshot report—provided answers.
The nine counties of SWPA are home to 1,054 arts & culture organizations (including parks and libraries). Why does Greater Pittsburgh have such a broad, diverse arts & culture sector?
Attendance at arts & culture events has risen 7.9% in recent years. Our 5,025,240 in paid attendance is higher than combined attendance at Steelers, Pirates, and Penguins games (3,477,267).
Subscription sales also increased 16% in five years.

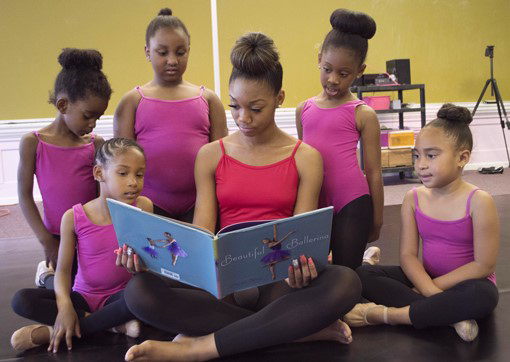
Hill Dance Academy Theatre
Government funding: we rank #2 among regions, thanks in part to our Allegheny Regional Asset District’s support of public assets.
Foundations: we rank #2 in per capita contributions, and our rise in foundation giving since 2009 of 35% also ranked #2.
Corporations: donations rose 17.6% since 2009.
GPAC will track these trends and will be on the lookout for changes in areas where we fared less well in 2016 Culture Counts. We also look forward to the June 2017 results of “Arts, Culture & Economic Prosperity 5.” In addition to data on economic impacts, GPAC is investigating intrinsic, social, and community impacts as well, all in order to provide broader evidence of the many ways the arts & culture sec-tor serves and benefits the general public of Greater Pittsburgh, where Culture Counts.
